Technical details
The technical details vary from smartphone to smartphone, as different acceleration sensors are installed in the respective models. Nevertheless, here is a rough overview of the technical data and details given.
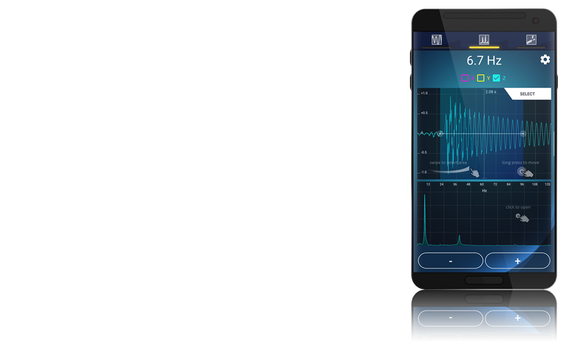
Sampling rate
By default, the maximum possible sampling rate of the smartphone is used to obtain the maximum spectrum of frequencies. The maximum detectable frequency is half the sampling rate (Nyquist frequency).

However, in the settings of the app, a lower sampling rate can also be set to reduce unnecessary memory and speed up the
calculation. The sampling rate should be carefully adapted by the engineer to the respective examination, so that the frequencies to be examined can also be mapped in the
spectrum.
Tip:
For low-frequency oscillations a lower sampling rate can be used to optimally analyze the oscillation. For higher-frequency
oscillations on the other hand, a higher sampling rate is well.
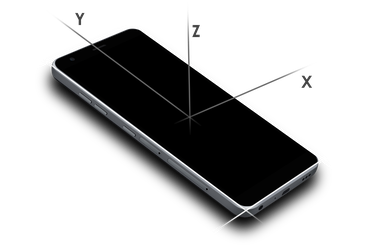
Axial directions
With the app, the accelerations in the X, Y and Z axis can be measured and analyzed. The X-axis runs in the transverse direction, the Y-axis in the longitudinal direction and the Z-axis comes out of the display plane. The following graphic shows the positive axis directions of the sensors.
Device orientation
In order to be able to better interpret the measured data subsequently, the position in which the smartphone was located during the
measurement is stored in the measurement file. There are 3 options available to the user:
- horizontal orientation
- vertical alignment
-
automatic alignment
For the first two options, the user defines the orientation for the measurement.
With automatic orientation, the smartphone automatically determines the position it is in during the measurement.
Downloads
You can download the manual of our app here for free.
You also can analyse the files with Matlab on your PC.
Matlab analysis file
Contact us to get the Matlab files we provide. With the help of Matlab you can easily import, plot and evaluate the measurement files created with the myFrequency app.
Contact apptodate-center@hotmail.com and we'll send you the files as a compressed Zip folder.
English version
German version

MEASURE. STORE. ANALYZE.
the app for vibration measurements
We hope that we can help you with our vibration app to facilitate the everyday life of vibration measurements. In case of problems or questions, we are always available for you at the following address.
Your team from

Contact:
apptodate-center@hotmail.com
DISCOVER OUR TWO APPS ON GOOGLE PLAY


FOLLOW US ON


On Facebook and Instagram we show you how we use myFrequency for vibration measurements. Follow us to stay up to date for new features.